Content from Introduction
Last updated on 2024-12-31 | Edit this page
Overview
Questions
How can digital tools facilitate processes related to planning and designing evaluation of digital/hybrid heritage experiences?
How can we choose appropriate methods and metrics for the evaluation of digital/hybrid heritage experiences?
Objectives
Define the purpose and key aspects to include when planning the evaluation of a chosen digital/hybrid experience, i.e. inputs, aims, objectives, outputs, outcomes
Identify how to move from questions and objectives to metrics and methods to be able to conduct evaluation
Tutorial
For this exercise we will outline the evaluation of a digital/hybrid interpretative application by going through the following steps:
- Choose context and type of application
- Think of the user of this application (or use already developed user persona)
- Define the essentials of evaluation plan through a checklist
- Map evaluation through the evaluation plan tool
- Define measurable criteria to meet the evaluation objectives
- Choose appropriate methods/tools to collect evidence
Content from Choose context
Last updated on 2024-12-31 | Edit this page
Step 1: Choose context and type of application
In this step you can choose the context and type of the digital experience application to evaluate. This can be:
- selected from the application examples in the list below;
- an application that you have been planning/designing through other training sessions (e.g. Digital Exhibition Design tutorial);
- an application of your choice.
You can find a list of examples applications.
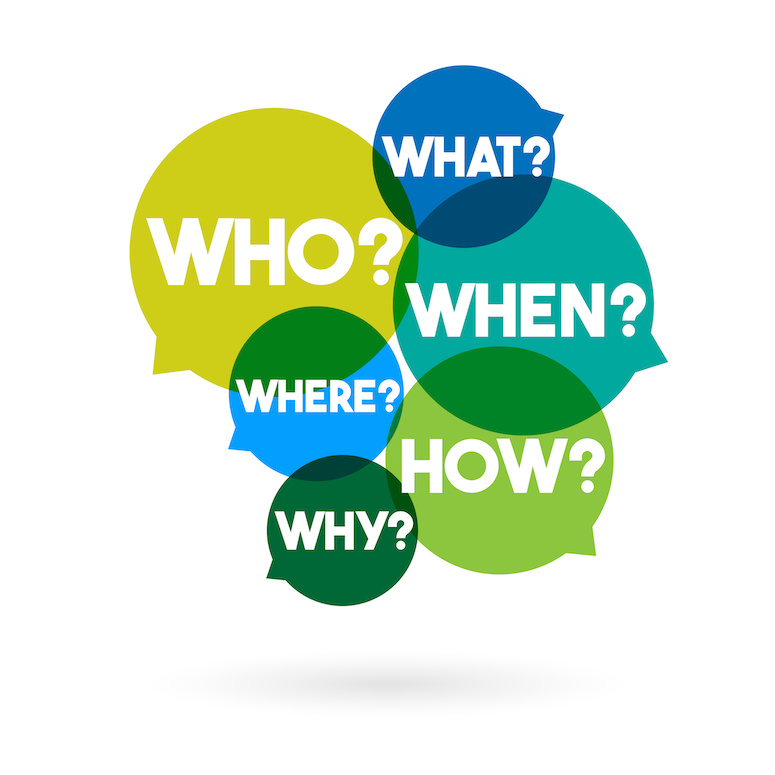
When you choose your application, use the 5W1H method, which is helpful to gather essential information about it:
- Who: who is the user of the application (audiences)?
- What: what will the user/s do? what is their task/s?
- Where: where will the user/s live the experience (physical environment, conditions, other users around)?
- When: when will the user/s perform the task (at home, in the exhibition?)
- Why: why do users perform the tasks (purpose, goal)?
- How: how will they perform the tasks?
Content from Think of the user
Last updated on 2024-12-31 | Edit this page
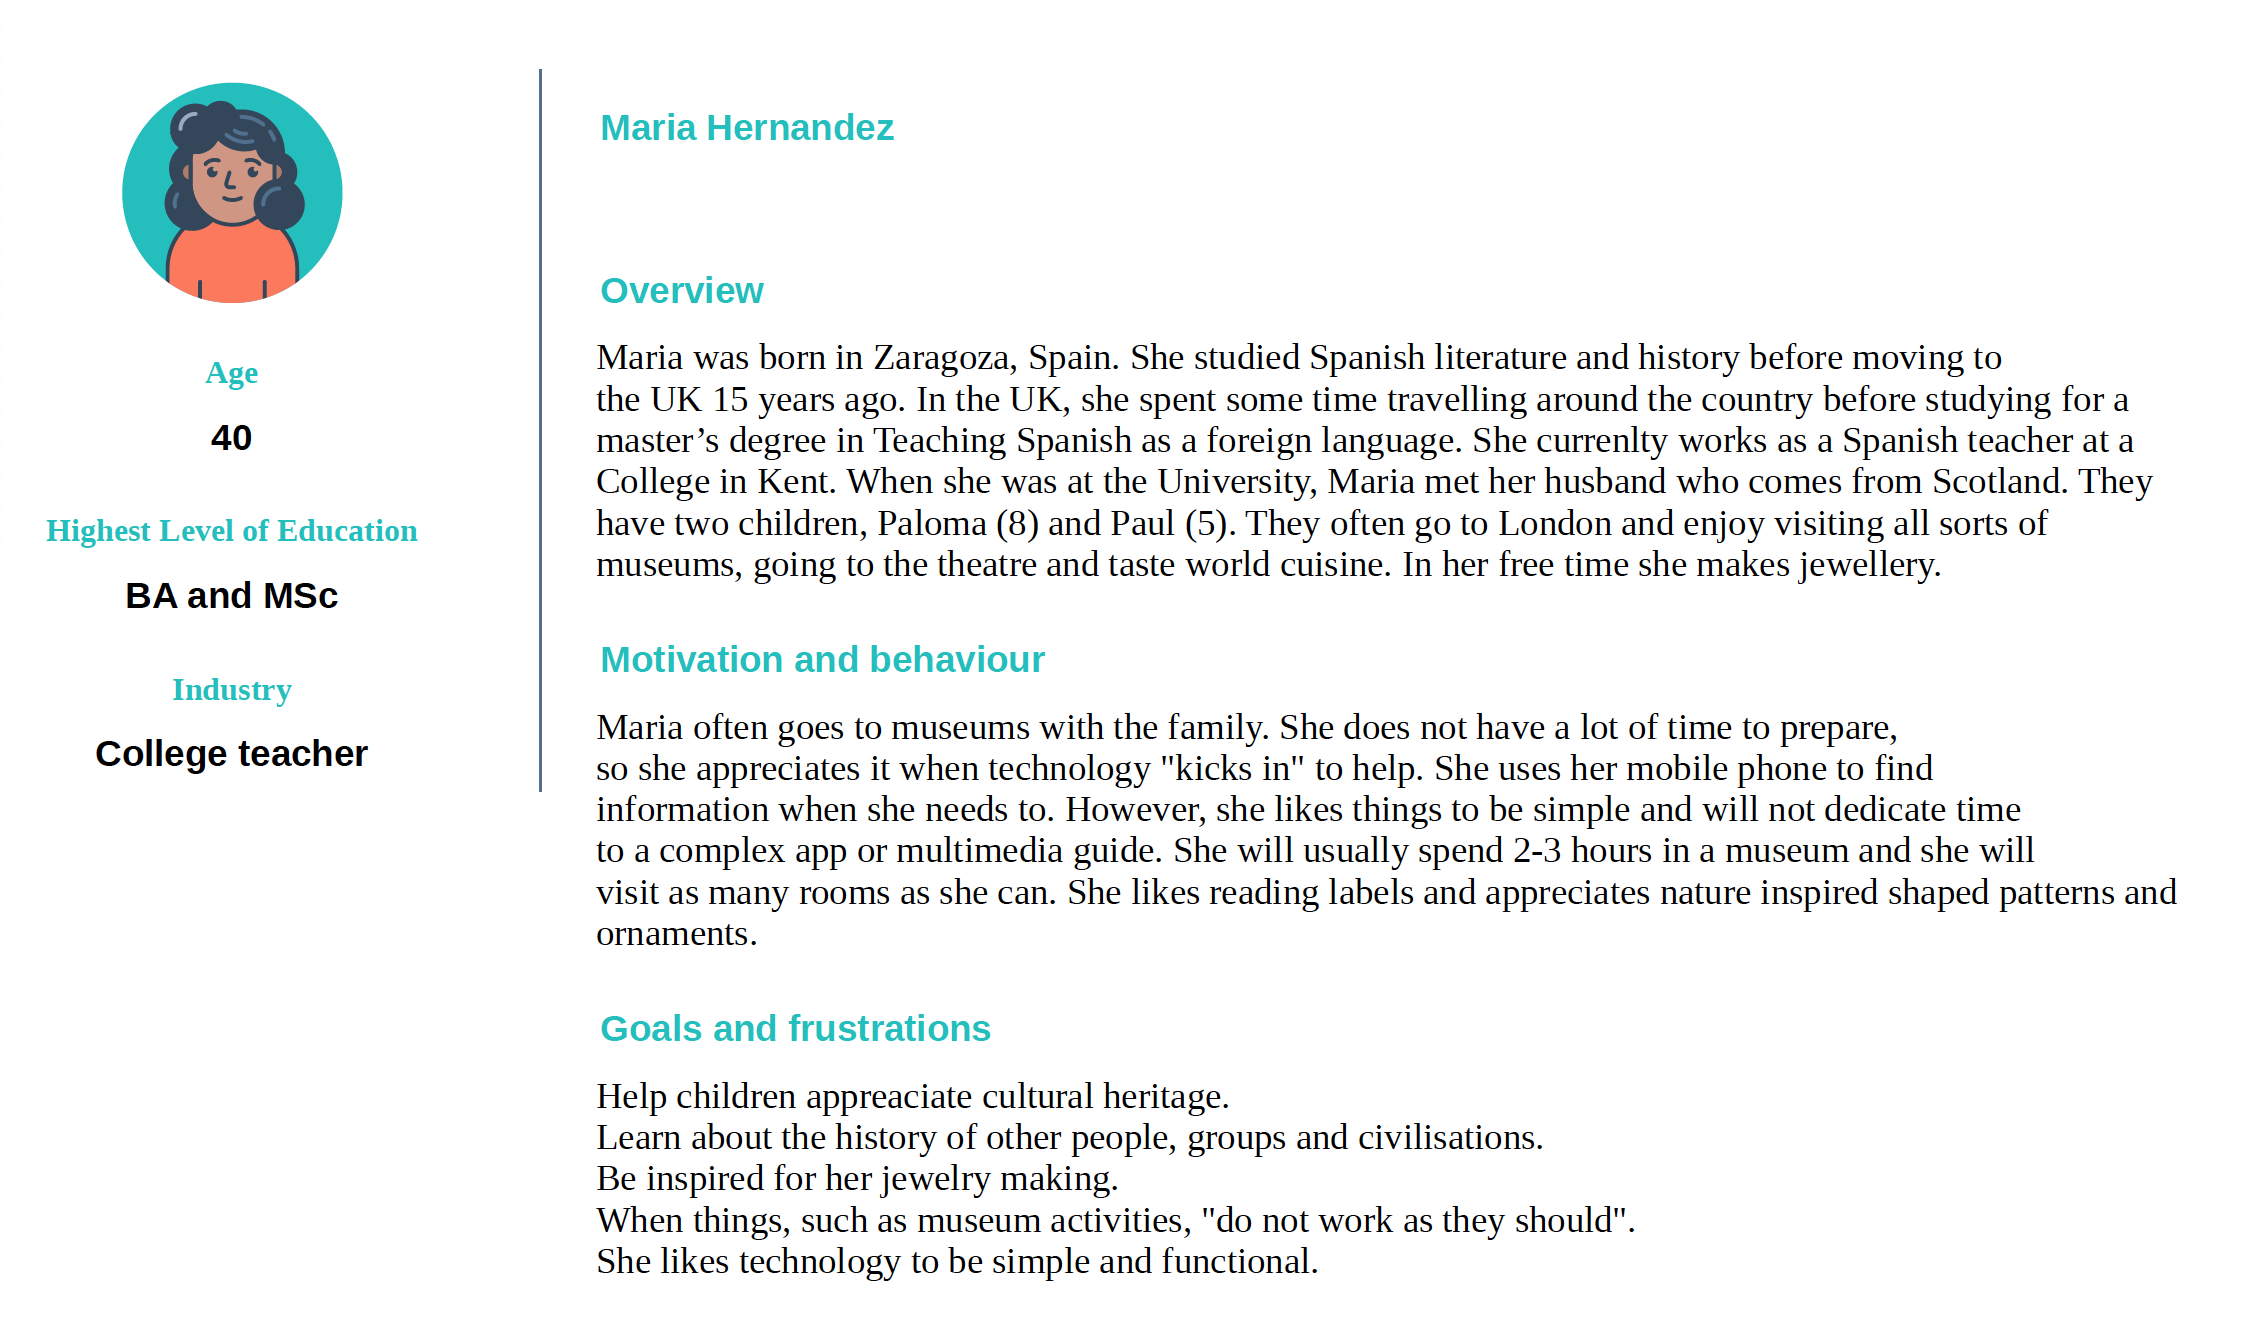
Step 2: Think of the user of this application (or use already developed user persona)
In this step you will think of the user of this application (i.e., application that you have planned in previous sessions, and you aim to evaluate or application chosen from the list in step 1).
If you have already developed a persona through the persona building method in the Digital Exhibition Design tutorial, please use the already existing persona/s.
This step aims to help you think about your user/s and their needs as a preparation stage for defining the essentials of your evaluation. It can also be particularly useful to identify the participants of your evaluation study.
Now think of how your persona/s would experience the digital application. To do that, look at various aspects of the UX (user experience) and try to think of how the application addresses questions, such as the following:
- How good is the provided information and media for the user/s?
- How easy is it for the user/s to interact with the application?
- Does the application provide what the user/s need?
- How quickly can the user/s find what they are looking for?
- Do the visual elements/aesthetics of the application please the user/s?
Content from Define the essentials
Last updated on 2024-12-31 | Edit this page
Step 3: Define the essentials of evaluation plan through a checklist
In this step, you will deploy a checklist as introduced by the Share Museums East (2020). Evaluation Toolkit for Museums. Page 32. Retrieved from: https://www.sharemuseumseast.org.uk/wp-content/uploads/2020/05/SHARE_Evaluation_Toolkit_FINAL_WEB.pdf
You can find the questions of the checklist below:
Rationale and context for evaluation
- What is the project / activity you are evaluating? Why are you carrying out the evaluation - what is its purpose?
- What type of evaluation is it (front-end, formative and/or summative)? If your evaluation will cover more than one of these, how will your stages of evaluation link to one another?
- Why will the findings be of interest and who will they be of interest to?
- Set your baselines – establish what quantitative and qualitative information you have currently that relates to your project.
- Decide how you will plan your evaluation and measure any outcome / impacts.
Aims, objectives, outcomes, impacts, outputs
- What are the aims and objectives of this activity / project?
- What are the proposed outputs of this activity / project?
- What are the proposed outcomes and impacts of this activity / project?
In-house or sourced evaluation
- Do you have the staff and time to deliver the evaluation in-house?
- If you need to commission an external consultant to do the evaluation for you, you will need to have answered most, if not all, the questions in the two boxes above if you are to write an evaluation brief. Thinking about answers to questions in the three boxes below will also help you to gauge whether the responses to your brief are realistic and appropriate to your needs.
- What needs to go in an evaluation brief for an external consultant?
Methods
- What are the proposed evaluation methods and how will these capture information that can measure your aims, objectives, outputs and outcomes?
- What baseline information do you have or need in order to demonstrate the progression or ‘distance travelled’ by your project or activity? If you don’t have this already, how could you collect it at the start of the activity?
Participants
- Who are your intended participants / target groups and how many people do you need to recruit or involve?
- What are your proposed sampling methods?
- Are your methods accessible to your intended audience?
- Do you need to consider any ethical issues? (e.g. are you working with vulnerable groups, do you need informed consent?)
- How will you collect feedback from people delivering the service to your visitors?
Recording data
- What methods do you propose to use to record the data gathered?
- Will these allow you to interrogate the data easily?
- Will the storage of data comply with GDPR and the Data Protection Act 2018?
This checklist and questions originate from:
Share Museums East (2020). Evaluation Toolkit for Museums. Page 32. Retrieved from: https://www.sharemuseumseast.org.uk/wp-content/uploads/2020/05/SHARE_Evaluation_Toolkit_FINAL_WEB.pdf
Content from Map evaluation
Last updated on 2024-12-31 | Edit this page
Step 4: Map evaluation through the evaluation planning tool
In this step, you will map evaluation by using the evaluation planning tool. This can be downloaded from the Share Museums East (2020). Evaluation Toolkit for Museums. Pages 79-80. Retrieved from: https://www.sharemuseumseast.org.uk/wp-content/uploads/2020/05/SHARE_Evaluation_Toolkit_FINAL_WEB.pdf or you can use a similar template, which you can find here.

The sections of the Evaluation Plan require the following information about the context of the digital experience you plan to evaluate:
- Inputs: These are the inputs invested in the project/application to produce outputs. Inputs include resources like time, finances, staff, and facilities.
- Aims: Aims are specific and intentional goals to achieve. Aims frame the desired outcome/s or purpose towards which efforts and actions are directed. An example of an aim could be: ‘to increase access to our collection for visually impaired visitors’.
- Objectives: Objectives outline the necessary actions to accomplish your aim/s and can serve to evaluate the project or activity. Objectives can be perceived as steps to achieve aims. Examples of objectives could be: ‘to enhance the interpretation of our collection/s for visually impaired audiences with the use of technology’, ‘to enable independent exploration of our collection with the use of technology for visually impaired audiences’, ‘to increase the numbers of visually impaired users who visit our museum’.
- Outputs: Outputs include everything produced as a result, such as courses, exhibitions, and talks, as well as metrics like attendance numbers. Outputs also comprise developed resources like handbooks, websites, or future plans. Similarly to the above examples, an output could be ‘a tactile exploration of replicas of our figurines with the aid of a mobile audio application’, ‘a tactile map with audio support at the entrance of the museum’.
- Outcomes: Outcomes reflect the overall result of outputs and the difference these will make. Outcomes usually involve qualitative measures that illustrate the effect of the project/application on individuals or groups. Outcomes can have effect/s for different stakeholders. In the context of the above examples, the outcome of a project could be ‘increased access and enjoyment of the collection for visually impaired users’.
If you have developed a project canvas for a digital experience through other tutorials (e.g. Digital Exhibition Design tutorial) you can use that information to map all the above.
Content from Define measurable criteria
Last updated on 2024-12-31 | Edit this page
Step 5: Define measurable criteria to meet the evaluation objectives
In this step you will look at your objectives, as outlined in the Evaluation Plan and define measurable criteria to assess them. Depending on the context of the digital experience you want to evaluate, you can deploy a framework to examine different aspects of the experience, such as:
The Generic Learning Outcomes Framework (GLOs) focusing on learning outcomes in the broader sense which include knowledge and understanding; skills; attitudes and values; enjoyments, inspiration, creativity; activity, behaviour and progression. This question bank could also facilitate framing questions around the GLOs of the experience.
The Generic Social Outcomes (GSOs) with a focus on strengthening public life, building stronger communities, and enhancing well-being.

In the context of User Experience (UX), you might also want to evaluate certain aspects of the experience of the digital application, such as:
- Utility: Is the user finding the system’s functions practical and appropriate for their needs? Usability: Does the user find it straightforward and efficient to accomplish tasks with the system?
- Aesthetics: Does the user find the system visually appealing? Is it pleasant to interact with?
- Identification: Can I relate to the product? Do I feel good about myself when using it?
- Stimulation: Does the system spark my creativity or provide exciting experiences?
- Value: Is the system significant to me? What value does it hold in my perspective?
Please note that many UX aspects reflect the GLOs and hence, when choosing which ones to include in your evaluation, you should be mindful not to repeat questions which will be identical or might yield to similar responses. What might not be covered thoroughly by the GLOs is Usability, an essential element of the UX. Usability in UX refers to the ease with which users can interact with a product or system to achieve their goals effectively, efficiently, and with satisfaction. Usability assesses how user-friendly and intuitive a product is, focusing on factors such as ease of learning, efficiency of use, memorability, error prevention and recovery, and user satisfaction. There are different ways to conduct usability testing, yet typically this includes a number of tasks which the users have to accomplish while facilitators observe, listen and make notes.
In addition, useful data to take into account when evaluating a digital application or system are log data, automatically generated to track transactions, changes, and performance metrics. Log data include page views, click-through rates, bounce rate, session duration, error rate, scroll depth and more.
More information on usability testing and the way/s to conduct it can be found here:
- Moran, K. (2019). Usability Testing 101. Nielsen Norman Group logoNielsen Norman Group. Retrieved from: https://www.nngroup.com/articles/usability-testing-101/
Looking at the examples of objectives, as proposed in the Evaluation Plan (previous step), these could be measured as follows:
- ‘to enhance the interpretation of our collection/s for visually impaired audiences with the use of technology’: this could be measured in terms of knowledge and understanding; skills; attitudes and values; enjoyments, inspiration, creativity; activity, behaviour and progression, as presented in the GLOs.
- ‘to enable independent exploration of our collection with the use of technology for visually impaired audiences’: this can be measured in terms of attitudes and values and/or activity, behaviour and progression, as presented in the GLOs. It can also be measured through usability testing, where users will attempt to accomplish tasks while facilitators observe, listen and make notes.
- ‘to increase the numbers of visually impaired users who visit our museum’: this can be measured by specific ticket sales over a certain period of time, organised visits from visually impaired groups etc.
Now, look at the objectives in the Evaluation Plan you have developed and try to define how to measure them. You can add your notes on the Evaluation Plan next to the objectives or use a separate document/sheet of paper to note them down.
More information on frameworks/criteria, data collection methods, data analysis and presentation as well as general guidance can be found here:
- Diamond, J., Horn, M., & Uttal, D. H. (2016). Practical evaluation guide: Tools for museums and other informal educational settings (Third;3; ed.). Rowman & Littlefield Publishers.
- Share Museums East (2020). Evaluation Toolkit for Museums. Retrieved from: https://www.sharemuseumseast.org.uk/wp-content/uploads/2020/05/SHARE_Evaluation_Toolkit_FINAL_WEB.pdf.
Content from Choose methods
Last updated on 2024-12-31 | Edit this page
Step 6: Choose appropriate methods/tools to collect evidence
In this step, you will have to choose the methods to collect evidence for your evaluation. You can add your notes about data collection methods in the Evaluation Plan next to the objectives and metrics or use a separate document/sheet of paper to note them down.
The choice of data collection methods depends on different criteria, such as the type of data we need to collect, time to dedicate to evaluation, cost, available staff, space/place of the evaluation, type of audience, language and other.
Some of the standard methods to collect evidence during evaluation are:
- Interviews
- Focus groups
- Questionnaires/surveys
- Observations
- Graffiti walls
- Visual methods (e.g., drawings with children).
Each method has its advantages and disadvantages. Some work best for a certain type of data we want to gather (e.g. interviews to gather qualitative insights), while others can enable more independent feedback and require less resources (e.g. graffiti walls).
Participants will have to be informed about the collection of data when this happens, and they will have to provide consent. In some cases, covert data collection (for instance through observation) might happen, yet there should be a sign somewhere in the museum/gallery notifying visitors about observation taking place and visitors would still have to provide consent for data to be used in the research often retrospectively.
Lastly, to perform data collection, mechanisms/tools to record, store, study, preserve, analyse and visualise data exist.
Some of the practical details to take into account with regards to certain data collection methods are:
- Interviews can be conducted online or face to face. Audio recording equipment should be used in face to face interviews and then tools to transcribe this material will be needed. Online interviews can be recorded, and some video conferencing software offers automatic transcription.
- Surveys can be done on paper, yet a web-based survey (using tools like LimeSurvey, SurveyMonkey and Google Forms) can facilitate data collection, analysis and presentation.
- Observations need a clearly designed protocol, so that researchers/staff know what to look for when observing visitor behaviours.
More information on observation protocols can be found here:
- Family Learning in Interactive Galleries (2018). Observation Protocol. Retrieved from: https://artmuseumfamilyspaces.files.wordpress.com/2021/08/232observationprotocol.pdf
- Linaker, L. (2018). The importance of Tracking and Observing Visitors in Cultural Institutions. Museum Whisperings. Retrieved from: https://museumwhisperings.blog/2018/02/25/the-importance-of-tracking-and-observing-visitors-in-cultural-institutions/
- Harknett, S.J. (n.d.). How To: Visitor Observation. Retrieved from: https://www.museums.cam.ac.uk/blog/resources/how-to-visitor-observation/
Content from Data Analysis
Last updated on 2024-12-31 | Edit this page
Data analysis and reporting
Data analysis depends on different factors, including type and volume of data, available time to analyse, cost, access to software, staff with skills to do the analysis and ultimately the purpose of the analysis itself.
Once you decide on an approach, reading through the data helps to identify emerging patterns, problematic questions, or unexpected results. Collaboration when going through the data can enhance insights and stimulate new ideas. When analysing data, quantitative and qualitative information will have to be interpreted in meaningful ways to address the main purpose of the evaluation. Depending on the data collected and analysis skills, providing quantitative information which is accompanied by qualitative insights can result in a more robust, well-rounded evaluation report.
Data of quantitative nature will usually be analysed by using appropriate software (Excel, SPSS, R and more). Deploying survey platforms (e.g., LimeSurvey, SurveyMonkey and Google Forms), as mentioned before, facilitates data analysis and visualisation. Identifying data parameters and relations helps to analyse data. For instance, it is possible to relate the age of participants with performance when interacting with a digital application. Percentages are used in analysis for larger sets of data, whereas when the sample is small, stating the number of participants should be enough for the analysis.
Qualitative data on the other hand, can be more difficult to analyse. Software is also available for qualitative data analysis (e.g., NVivo, ATLAS.ti). When analysing qualitative information, it is good to have an open approach towards the data and go through the dataset various times before starting to code responses and highlight key themes, as they emerge from discussions, agreements and disagreements. Both positive and negative aspects should be noted, analysed and presented to avoid bias and ensure that an honest representation of the evaluation will be provided. Identifying noteworthy words, phrases, and unexpected discoveries can enhance the depth of the analysis report. Incorporating relevant quotes can further elucidate essential aspects of qualitative insights within the report.
Now with regards to the evaluation report, some general principles to follow when producing this document include:
- Articulating clear statements regarding the achievement of success criteria.
- Ensuring anonymity of participants in the report.
- Utilising visual aids and percentages for better comprehension, incorporating charts, graphs, and word clouds.
- Enhancing understanding by including images that visually represent results, ensuring proper consent from individuals depicted.
- Integrating anonymised quotes from qualitative data.
- Providing context by including comparisons with previous years’ data and similar museums, events, or projects.
Lastly, the report must be clearly structured to address all the evaluation aspects and demonstrate the rationale, methodology, realisation and interpretation of the results along with future plans. Hence, the report should comprise:
- Executive summary, highlighting the key points of the report.
- Introduction and background, providing the context of the digital experience project in terms of aim/s, objectives, outputs and outcomes.
- Methodology, explaining data collection methods’ choices, sampling, pilots, lessons learned, changes.
- Discussion, presenting evidence from the data, analysing key themes and reflecting on strengths, and weaknesses of the digital experience and its contribution towards the desired outcomes.
- Conclusion, summarising the findings of the evaluation.
- Recommendations and future plans, explaining how the evaluation will enable changes in policies, strategic thinking and actions towards the desired outcomes.
- Appendices with copies of the survey, interview questions, observation protocols etc.
More information on data analysis and reporting:
- Share Museums East (2020). Evaluation Toolkit for Museums. Retrieved from: https://www.sharemuseumseast.org.uk/wp-content/uploads/2020/05/SHARE_Evaluation_Toolkit_FINAL_WEB.pdf
- British Museum (2006-). Visitor Research and Evaluation. Retrieved from: https://www.britishmuseum.org/research/projects/visitor-research-and-evaluation
- South West Museum Development. Effective Evaluation Planning. Retrieved from: https://southwestmuseums.org.uk/resources/effective-evaluation-planning/
- The Audience Agency. Visitor Guidelines: Part 3. How to Analyse Visitor Survey Responses. Retrieved from: https://www.culturehive.co.uk/wp-content/uploads/2020/10/AA_How-to-Analyse-Survey-Responses-1.pdf